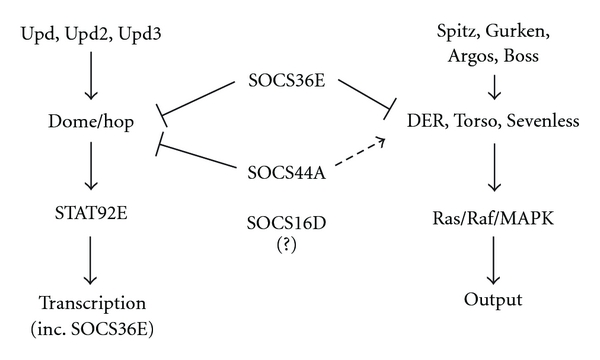
Figure 3.

Schematic representation of the interaction of SOCS proteins with the JAK/STAT and EGFR pathways. Positive regulation indicated by arrows and negative regulation represented by blunt-ended arrows. Dashed line arrow indicates context-specific positive regulation.
