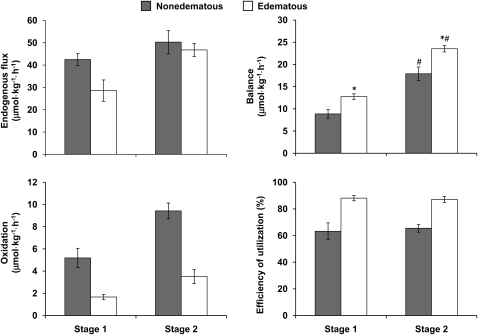
FIGURE 1.
Mean (±SEM) cysteine endogenous flux, balance, oxidation, and efficiency of utilization in children diagnosed with nonedematous (shaded bars; n = 10) and edematous (open bars; n = 9) severe childhood malnutrition at stage 1, ∼4 d after admission, when severely malnourished, and at stage 2 ∼20 d after admission when the children had replaced 50% of their weight deficit. Analyses were performed by using repeated-measures ANOVA. Flux: main effect of diagnosis and stage terms, P < 0.02; stage-by-diagnosis interaction, P = 0.4. Balance: *Significantly different from nonedematous patients in the same clinical phase, P < 0.05. #Significantly different from corresponding clinical phase, P < 0.05; stage-by-diagnosis interaction, P < 0.02. Oxidation: main effect of diagnosis and stage terms, P < 0.001; stage-by-diagnosis interaction, P = 0.05. Efficiency of cysteine utilization: main effect of diagnosis term, P < 0.03; stage-by-diagnosis interaction, P = 0.42.

