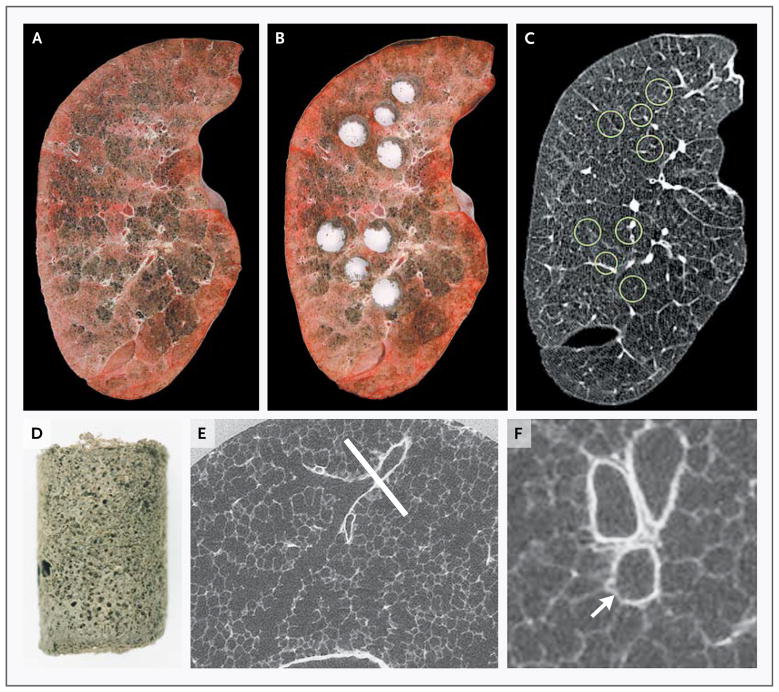
Figure 1. Lung-Tissue Samples Matched with CT Images.
Panel A shows a frozen lung slice from a patient with severe centrilobular emphysema, and Panel B shows the same lung slice after samples were removed for analysis. Panel C shows the matching slice from the multidetector CT scan of the intact lung specimen, with the location of samples indicated by circles. Panel D shows a single control lung sample after it was processed for microCT. Panel E shows a microCT image of a control lung at a resolution of 16.24 μm, with a terminal bronchiole (indicated by the white line) at the point at which it branches into respiratory bronchioles. Panel F shows the same terminal bronchiole reoriented to show the cross section of the airway (arrow) at the plane of the section indicated by the line in Panel E.

