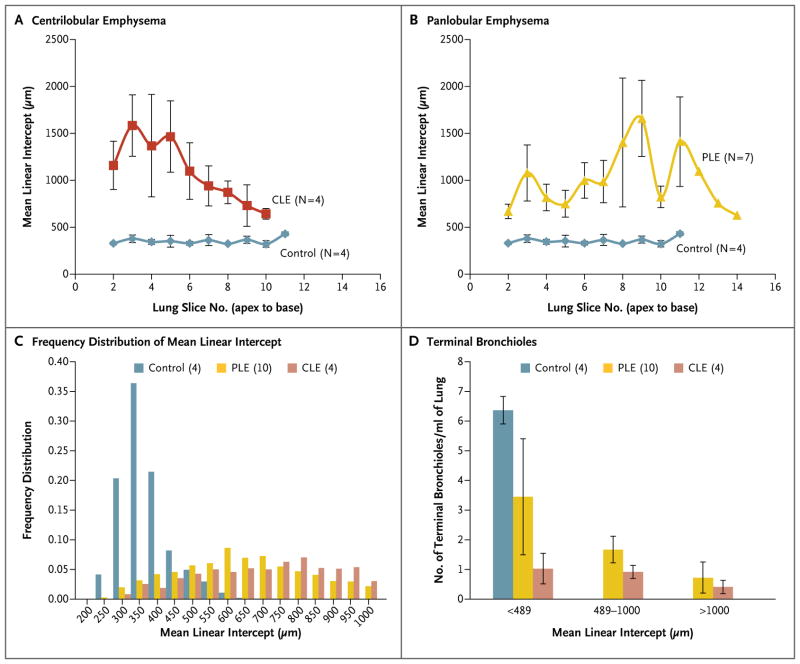
Figure 3. Mean Linear Intercept and Number of Terminal Bronchioles, According to the Emphysematous Phenotype of COPD.
Measurements of the mean linear intercept show the expected distribution of emphysema from lung apex to base in lungs from 4 patients with centrilobular emphysema (CLE) (Panel A) and 7 patients with panlobular emphysema (PLE) (Panel B), with no change as a function of lung-slice number in the 4 control lungs. In Panel C, the frequency distribution of measurements of the mean linear intercept is shown in the 4 control lungs, as compared with the frequency distribution in the 4 lungs affected by CLE and 10 lungs affected by PLE. In Panel D, the regions of the diseased lungs in which the mean linear intercept remained below the upper limit of the 95% confidence interval for the control lungs (<489 μm) have a reduced number of terminal bronchioles per milliliter of lung volume in the CLE group (P<0.001) and remain low in samples with a mean linear intercept of 489 to 1000 μm and of more than 1000 μm. The I bars indicate standard errors.

