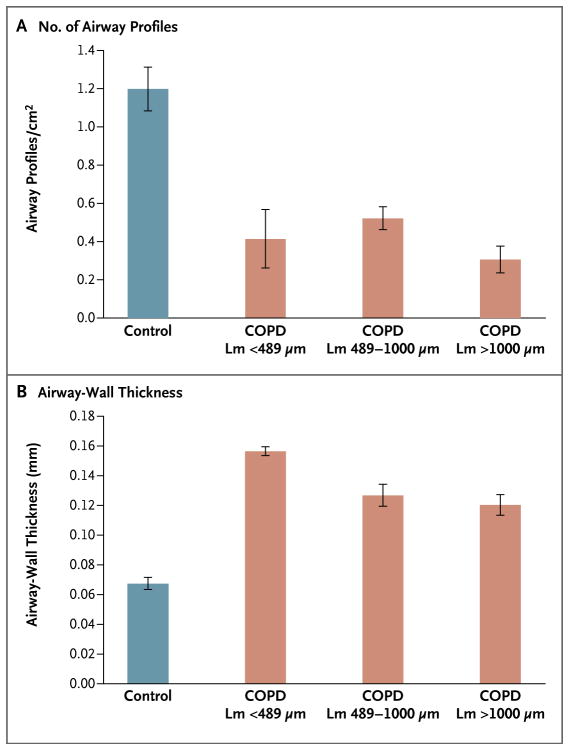
Figure 4. Airway Profiles and Airway-Wall Thickness, According to the Extent of Emphysema in COPD.
Shown are the number of small-airway profiles per square centimeter (Panel A) and the thickness of the airway walls (Panel B), as measured from histologic sections cut from samples of tissue adjacent to those examined on microCT. The number of small-airway profiles per unit area is sharply reduced in regions of diseased lungs in which the mean linear intercept (Lm) remains below the 95% confidence interval (489 μm) observed in control lungs and the surviving airways have thickened walls. The I bars indicate standard errors.

