
Figure 10.
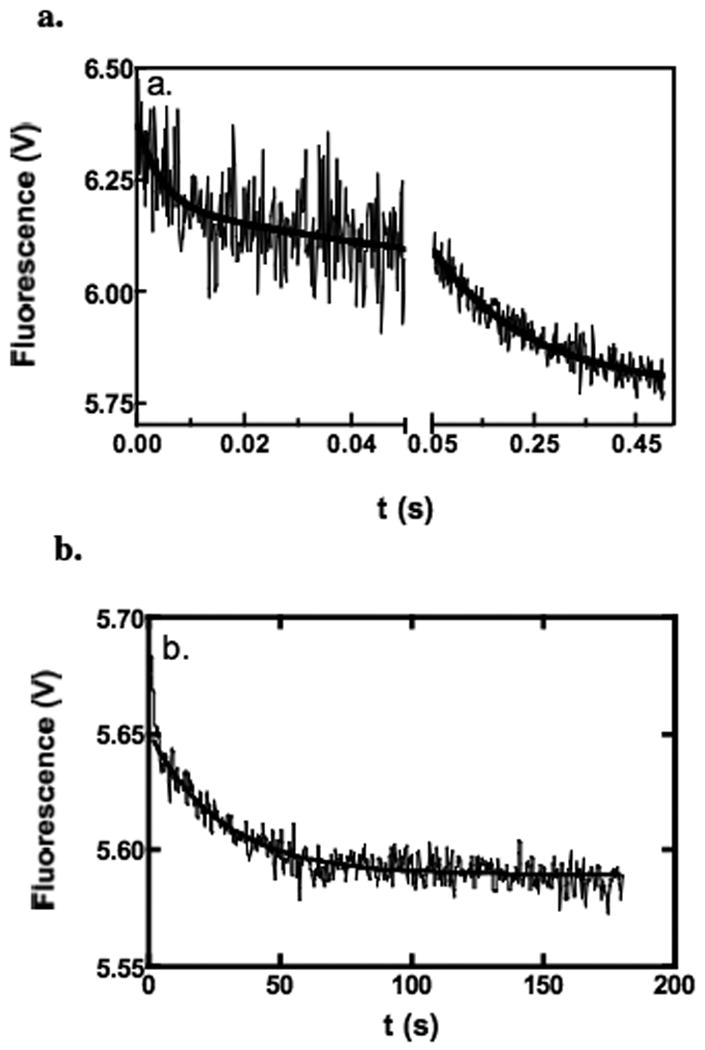
Examples of fluorescence stopped-flow traces showing the kinetics of MgTNP-ATP displacement from pyruvate carboxylase by acetyl CoA. Reactions were performed at 30°C in 0.1M Tris-Cl, pH 7.8 containing 20 mM NaHCO3, with 0.5 μM pyruvate carboxylase and 10 μM MgTNP-ATP in one syringe and 0.1 mM acetyl CoA in the other. (a) Fast and intermediate phases (500 data points collected in the range 0-0.04 s and 500 data points collected in the range 0.04-0.5 s, average of 23 traces). Lines represent a fit to a double exponential equation, where data points up to 1 ms have been excluded from the fit (k1 = 220 ± 69 s-1, k2 = 5.4 ± 0.6 s-1). (b) Slow phase of the displacement of MgTNP-ATP from the enzyme-MgTNP-ATP complex by 0.1 mM acetyl CoA. (1000 data points collected in the range 0-180 s). Line represents non-linear least squares regression fit of the data to a single exponential functions (k = 0.036 ± 0.001 s-1), where data points up to 3 s have been excluded from the fit.