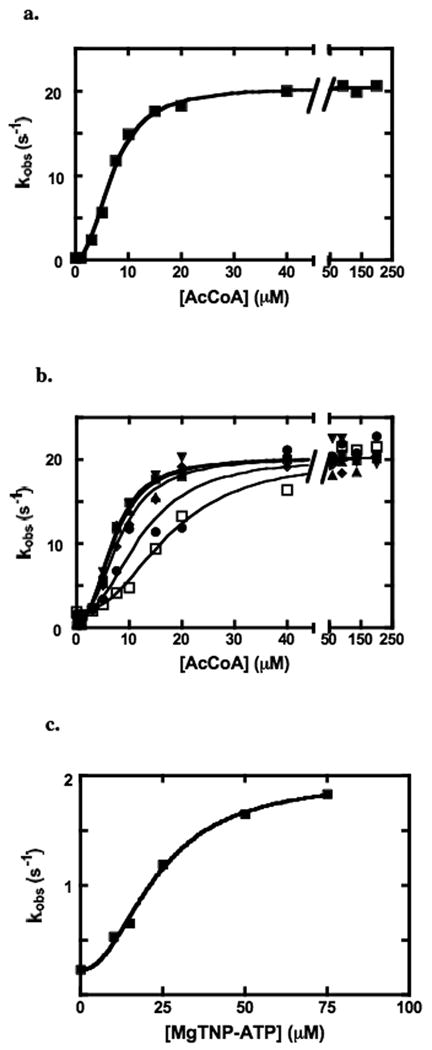
Figure 4.

(a) Activation of the pyruvate carboxylation reaction by acetyl CoA (see Materials and Methods for reaction conditions). The solid line represents the non-linear least squares regression fit of the data to equation (i) (see Materials and Methods). (b) Activation of pyruvate carboxylase by acetyl CoA at different fixed concentrations of MgTNP-ATP: (■) 0 μM; (▲) 10 μM; (▼) 15 μM; (◆) 25 μM; (●) 50 μM; (□) 75 μM. Solid lines represent a global non-linear least squares regression fit of the data to equation (ii) (R2 =0.98) (see Materials and Methods). (c) Replot of the data in the absence of acetyl CoA from (b), showing the activation of the enzyme by MgTNP-ATP in the absence of acetyl CoA The solid line represents a fit of the data to equation (i), with nt and KT replacing n and Ka.
