
Figure 9.
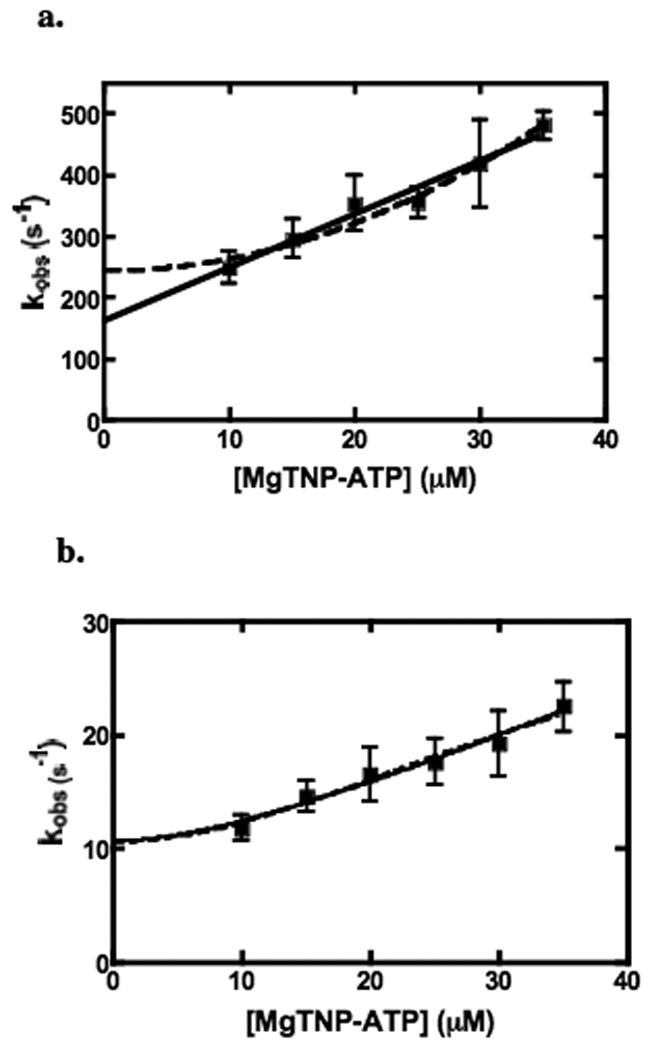
Plots of kobs for the fast (a) and intermediate (b) phases of MgTNP-ATP binding vs [MgTNP-ATP], as determined by stopped-flow fluorescence measurements. In (a), the solid line represents a fit to the equation (v) and the dashed line to equation (vi) (see Materials and Methods). In (b), the dashed line represents a fit to equation (viii) and the solid line represents a fit to equation (ix) (see Materials and Methods). Error bars indicate the standard deviations of the means n determinations of the rate constant, where n ≥ 4 and where at least 5 stopped-flow traces were averaged for each determination.