
Figure 1.
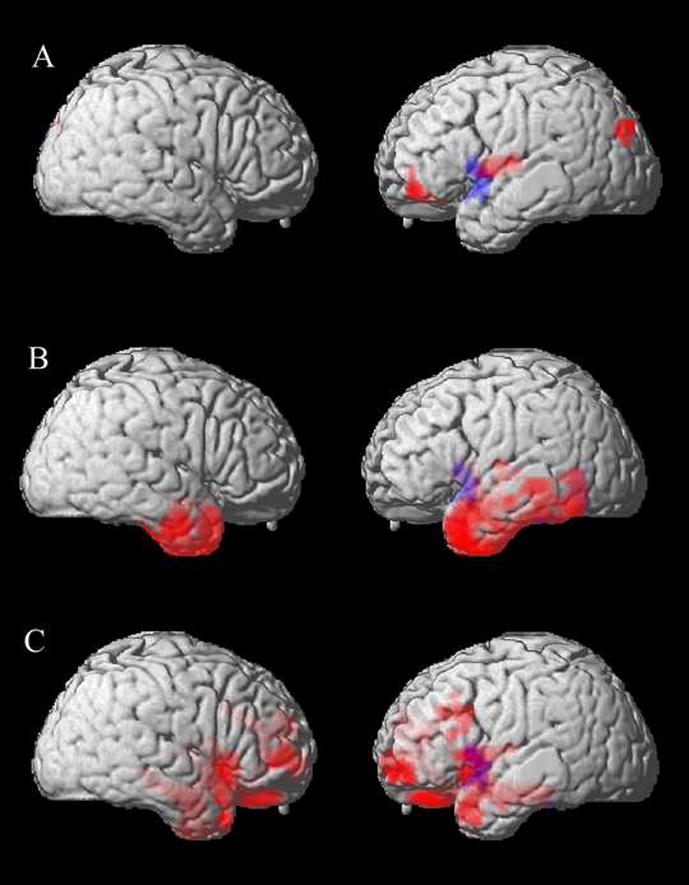
Correlations between cortical atrophy and speech fluency in progressive non-fluent aphasia, semantic dementia, and patients with a social and executive disorder. Red areas indicate the anatomic distribution of significant cortical atrophy in each subgroup. The blue area indicates the distribution of the significant association between non-fluent speech and cortical volume for all FTLD patients. Panel A: PNFA; Panel B: SemD; Panel C: SOC/EXEC.