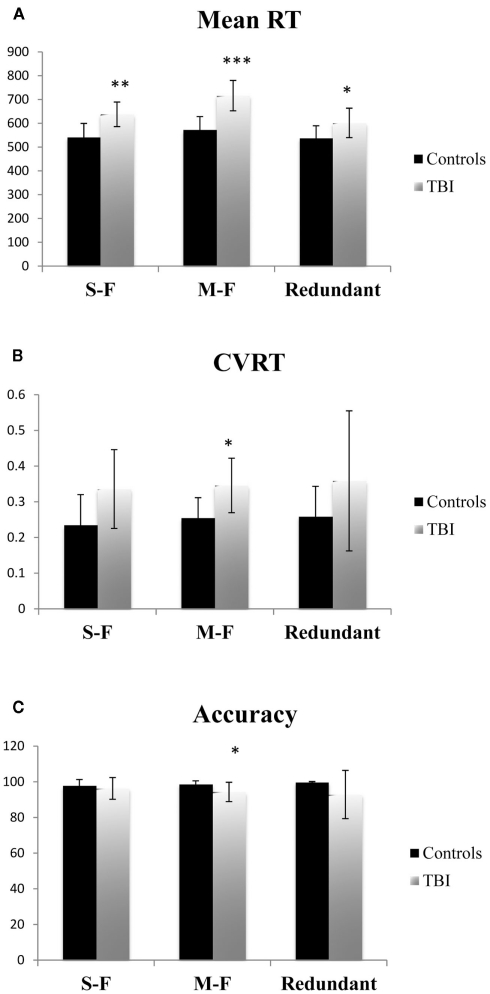
Figure 2.
Mean reaction time (RT) (A), coefficient of variation on reaction time (CVRT) (B), and (C) accuracy for each task condition for functional imaging control subjects and TBI patients. Error bars indicate SE of the mean. *= Significant differences between controls and TBI (p < 0.05). **= Significant differences between control and TBI (p < 0.01).

