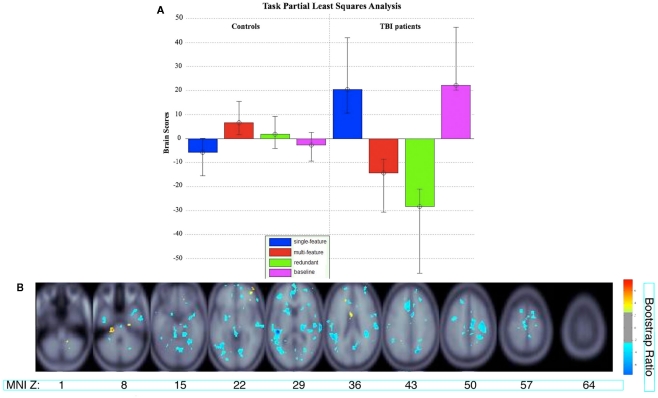
Figure 3.
(A) Brain scores for the significant latent variable (LV) from the task PLS analysis. Error bars indicate confidence intervals. The average brain scores for each group and condition are considered to reliably contribute to the LV if the confidence interval does not cross 0. The brain scores are similar to factor scores and indicate how strongly an individual subject expresses the patterns on the latent variable. The score is the dot product of the subject’s raw brain activity data and the singular image from the latent variable showing the pattern of brain activity that is most related to the group and task differences (McIntosh et al., 2004). (B) Singular image showing reliable clusters (number of voxels ≥ 50 for positive saliences, number of voxels ≥ 250 for negative saliences, bootstrap ratio ≥ ±2.5). The brain activity patterns occur five lags (10 s) after stimulus onset time. The X axis shows the location of the axial slice with a coordinate along the Z axis in MNI atlas space. Warm colors indicate clusters with positive bootstrap ratios, which were more active in group and task conditions with positive brain scores in (A). Cool colors indicate clusters with negative bootstrap ratios, which were more active for group and task conditions with negative brain scores. Letter designations serve as a cross-reference to regions listed in Table 2. The bootstrap ratio map is superimposed on the average anatomical scans from all 18 subjects.

