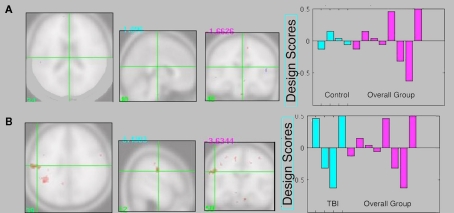
Figure 5.
(A) Intersection between control Task PLS analysis and overall group analysis. There is very little overlap in brain activity patterns. (B) Intersection between TBI Task PLS analysis and overall group analysis. Several regions show overlapping activity, including two larger clusters in the left inferior parietal lobule, suggesting the brain activity patterns in the overall analysis are primarily being driven by the TBI group. Design score plots show pattern from the single group analysis in blue and the overall group analysis in pink (repeated from Figure 3A), with design scores for the single-feature, multi-feature, redundant, and baseline conditions shown from left to right for each group. The design scores reflect how much the task condition contributes to the overall latent variable pattern for each group.

