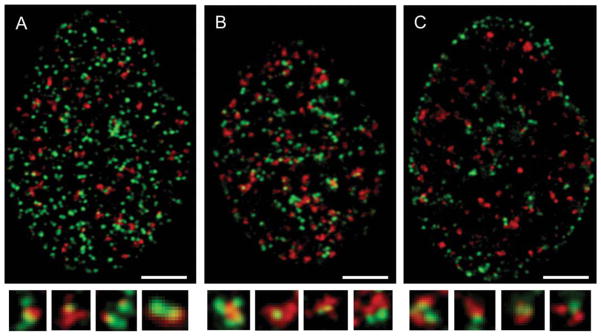
Figure 4.
Relationship between the sites of EdU incorporation and the induction of γH2AX foci in A549 cells treated with H2O2 Confocal images of A549 nuclei (selected equatorial planes) that were exposed to EdU for 30 min and then to H2O2 for additional 30 min. The incorporation of EdU was detected using the “Click-iT® methodology utilizing AlexaFluor 488-tagged azide (green fluorescence), whereas γH2AX was detected immunocytochemically with the secondary Ab labeled with AlexaFluor 568 (red fluorescence). The bottom panels show the sites of EdU incorporation that are in close proximity or colocalize with γH2AX foci, selected from the respective cell images (enlarged). The size marker = 5 μm.

