
Fig. 1.
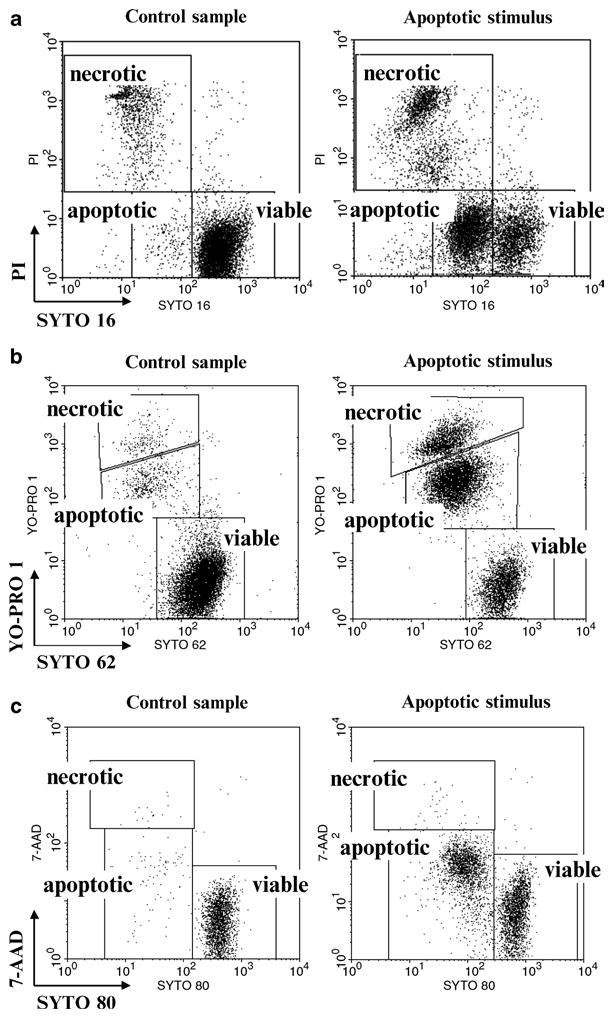
Discrimination of viable, apoptotic, and late apoptotic/necrotic cells using selected SYTO probes and plasma membrane permeability markers: (a) SYTO 16 probe in conjunction with plasma membrane permeability marker pro-pidium iodide (PI). Both probes were excited using 488 nm laser. SYTO 16 and PI fluorescence signals were logarithmically amplified using 530 and 575 nm band-pass filters, respectively. Debris were excluded electronically. Analysis based on bivariate dot plots SYTO 16 vs. PI is shown. (b) SYTO 62 probe in conjunction with plasma membrane permeability marker YO-PRO 1. Probes were excited using 633 and 488 nm lasers, respectively. Logarithmically amplified fluorescence signals were collected using 660 and 530 nm band-pass filters, respectively. Debris were excluded electronically. (c) SYTO 80 probe in conjunction with plasma membrane permeability marker 7-aminoactinomycin D (7-AAD). Both probes were excited using 488 nm laser. SYTO 80 and 7-AAD fluorescence signals were logarithmically amplified using 575 and 677 nm band-pass filters, respectively. Debris were excluded electronically.