
Figure 5.
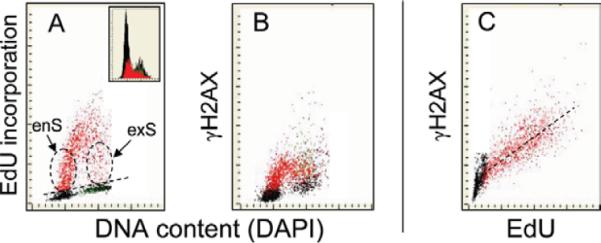
Correlation between DNA replication detected by EdU incorporation and the UV-induced H2AX phosphorylation detected immunocytochemically in A549 cells. Exponentially growing cells were incubated for 60 min with EdU then exposed to 50 J/m2 of UV-B light, incubated for 30 min and fixed. The incorporated EdU was detected using Alexa Fluor 488 azide (green fluorescence), γH2AX was detected immunocytochemically with Alexa Fluor 633 secondary Ab (far red fluorescence), DNA was stained with DAPI (blue fluorescence) and fluorescence was measured by LSC (61). Using the “paint-a-gate” multiparameter analysis, the EdU-incorporating cells were marked as red (A). Note that expression of γH2AX is predominantly in the EdU incorporating cells (B) and is proportional to the intensity of EdU labeling (C). [Color figure can be viewed in the online issue, which is available at wileyonlinelibrary.com.]