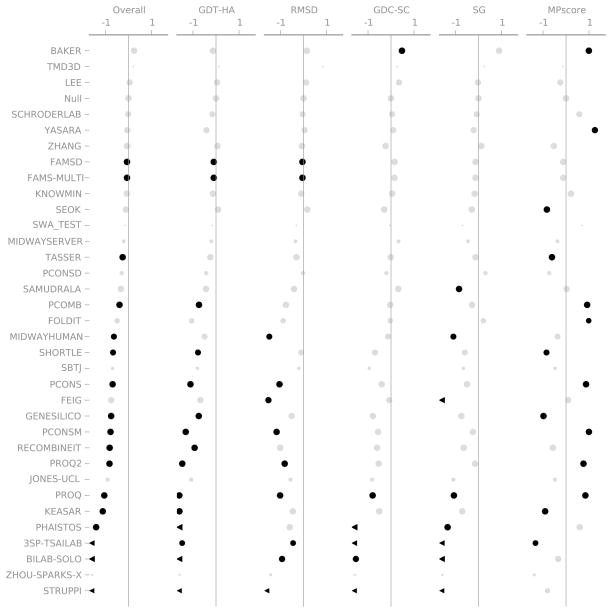
Figure 7.
Summary of the results of the CASP9 Refinement Experiment. Only the models designated as “Model 1” are included. Each column shows one of the metrics we used to evaluate performance. The scales are marked at +/− 1 median absolute deviation (MAD) relative to the Null group. Black points are statistically distinguishable from the Null group; grey points are indistinguishable (Wilcoxon signed-rank test, p = 0.05). The area of each point is proportional to the number of targets that group attempted. A chevron indicates that the corresponding score was off the scale.

