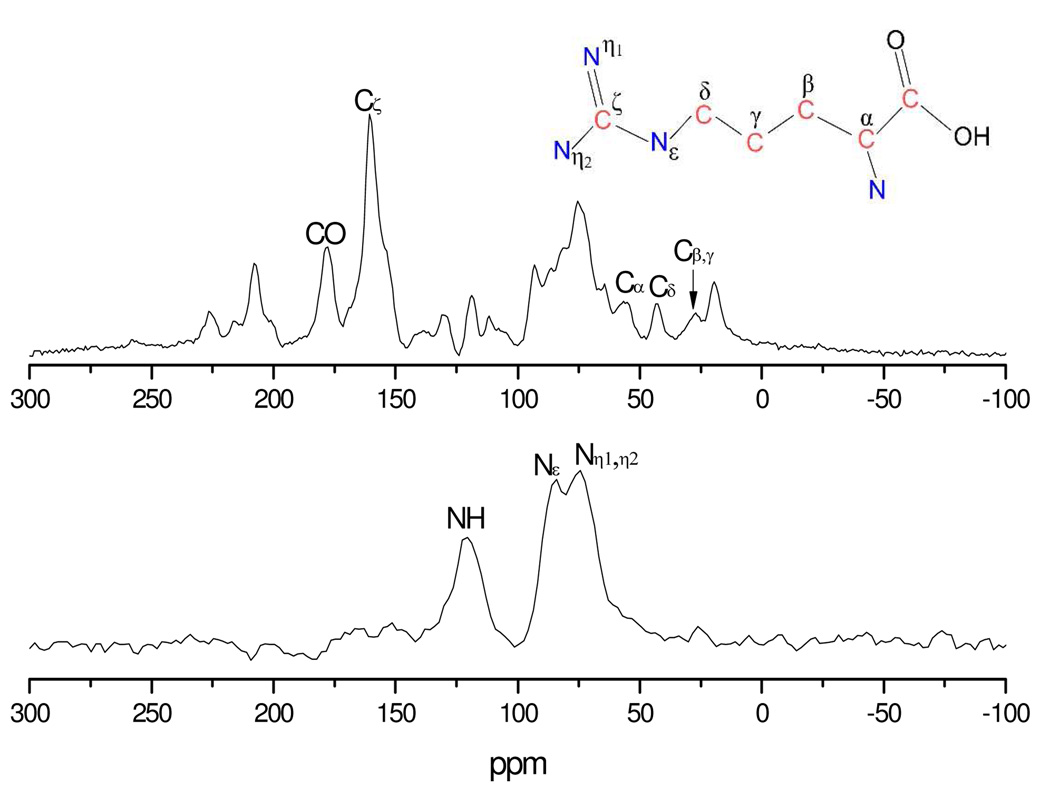
Figure 2.
Reference REDOR MAS spectrum (S0) recorded at the initial dephasing time point along with spectral assignments. 13C observed spectra were obtained with 20,000 scans under a spinning speed of 6,000 Hz, while 15N observed spectra were obtained with 22,000 scans under a spinning speed of 8,000 Hz. The inset shows the position of each carbon and nitrogen in the arginine amino acid

