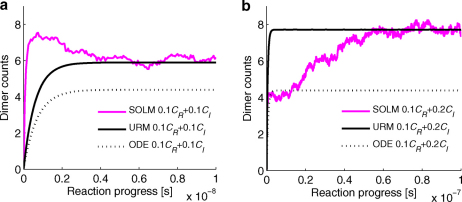
Figure 7. Demonstration of URM as a method for adjusting for crowding effects in simulations.
Each plot shows a comparison of a full SOLM model, an ODE model ignoring crowding effects, and an ODE model using the URM to adjust for crowding in the simulation. Each SOLM simulation uses default parameter values (B = 0.7, M = 1ns, D = 6.95×10⁻¹¹m2s−1, and α = 2, β = 1, dth = 0.5nm). Each SOLM curve shows an average over 30 repetitions, with error bars omitted for clarity. ODEs are simulated using estimated rate parameters from the quasi-ideal equilibrium constant in table 1 and default parameter value of M. URM simulations are simulated using the default value of M to derive reverse rates and URM estimates of keq to determine forward rates for the given M. (a) total concentration 0.2 (0.1 CR + 0.1 CI). (b) total concentration 0.3 (0.1 CR + 0.2 CI)

