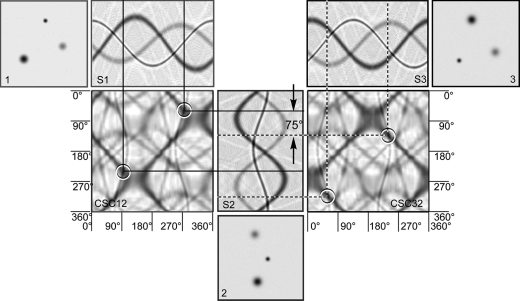
Figure 22.
Sinograms and sinogram correlation functions for a model structure. Three projections (numbered 1–3) are shown of a model composed of three Gaussian dots with different densities. S1, S2, and S3 are sinograms or sets of 1D projections of the corresponding 2D projections. CSC12 and CSC32 represent cross-sinogram correlation functions between projections 1 and 2 and projections 3 and 2, respectively. Each point of the sinogram correlation function contains the correlation coefficient of a pair of lines from the two sinograms. Solid lines indicate the common lines between projections 2 and 1, while the dashed lines indicate the common lines between projections 2 and 3. Each CSC has two peaks because projections from 180° to 360° mirror those from 0° to 180°. The angular distance between the common lines (solid and dashed) gives the angle between projections 1 and 3.

