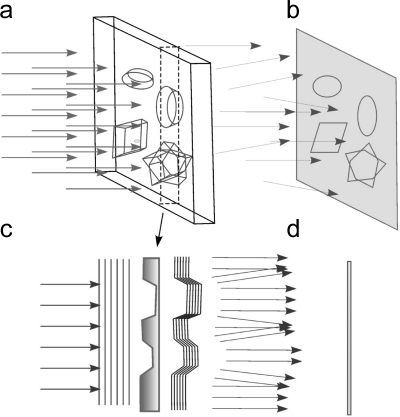
Figure 7.
Phase contrast. (a) A phase object illuminated by a parallel beam. (b) The resulting image shows only weak features. (c) A cross section of the object outlined by dashed lines in (A). Arrows show the changes in the wavefront (parallel lines) after interaction with the sample. The intensity is not changed, but the wavefront becomes curved. (D) Intensity of the rays creating the image in the region of the cross section. Note that the intensity differences are small.

