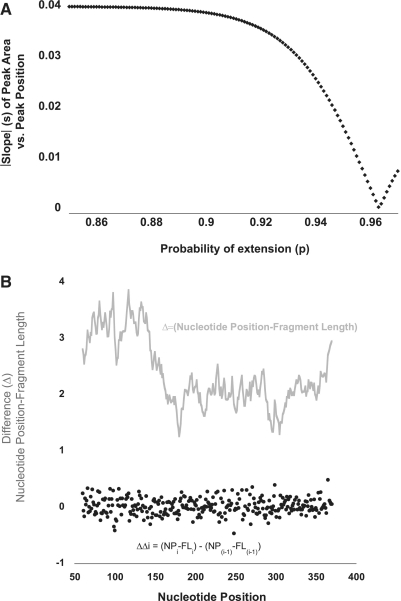
Figure 2.
(A) Signal decay correction. Graphical depiction of the empirical determination of P in equation (1). Signal decay in an electrophoretic trace—in which smaller fragments have larger peak areas compared with longer fragments—can be described by an exponential decay function. Parameter P (probability of extension) can be determined empirically by testing values for P such that a line fit to the corrected peak area (peak area/D) versus DNA fragment length, has a slope, s, that is minimized. (B) Fragment length is an imperfect reflection of nucleotide position. Fragment length does not perfectly correlate with nucleotide position; their difference is depicted (grey line). This changing offset is the result of band compression. FAST algorithmically calculates this changing offset (grey line), using the observation that the offset can only change (delta–delta, black filled circles) in an incremental fashion. This allows for proper peak-to-nucleotide position correlation (peak identification). NP = nucleotide position; FL = fragment length. See text for further discussion.

