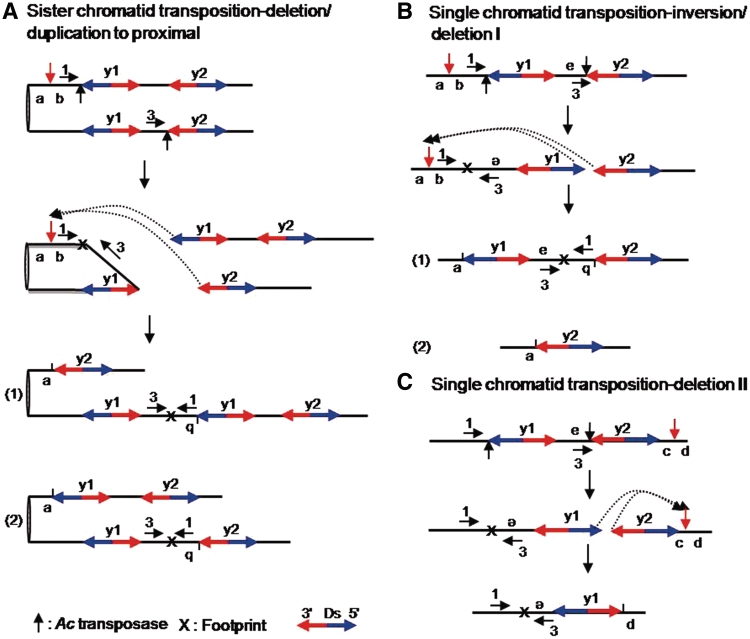
Figure 4.
Models for SCT with a proximal target site and SLCT. (A) SCT is depicted in two steps. In all the diagrams, sister chromatids are attached at the centromere (left). Element y1 and y2 indicate Ds-y1 and Ds-y2, respectively. Transposases cut the 5′-end of y1 on the upper chromatid and the 3′-end of y2 on the lower chromatid, as indicated by the black vertical arrows in the top diagram. The two ends are then reinserted into a new target site between a and b, as shown by the dotted arrows in the second diagram. A red vertical arrow indicates the new target site. Part (1) of the third diagram shows that insertion of the 3′-end of y2 next to a and the 5′-end of y1 next to b generates one chromatid (upper) containing a flanking proximal deletion and a single copy of Ds, and a second chromatid (lower) containing an inverted duplication and three copies of Ds. Part (2) of the fourth diagram shows that insertion of the 5′-end of y1 next to a and the 3′-end of y2 next to b generates one chromatid (upper) containing a flanking proximal deletion and two copies of Ds, and a second chromatid (lower) containing an inverted duplication and two copies of Ds. Note both outcomes result in inversion of sequences flanking Ds. Blue and red arrows indicate the 5′ and 3′ directions of Ds elements, respectively. X indicates a footprint. Primers used to detect rearrangements were shown as horizontal arrows with numbers. (B) The inversion/deletion I process derived from SLCT is depicted in three steps. Transposases cut the 5′-end of y1 and the 3′-end of y2, as indicated by the black vertical arrows in the top diagram. The 5′ and 3′ termini of y1 and y2, respectively, are re-inserted into the proximal region with respect to the original Ds sites, as shown by the dotted arrows and red vertical arrow in the second diagram. Consequently, the fragment from the reinsertion site on the 5′-end of y1 was inverted and was jointed to the 3′-end of y2. Reinsertion of the 5′ and 3′ termini of y1 and y2, respectively, at the target site between a and b leads to two configurations, as shown in parts (1) and (2) in the diagram. Part (1) shows inversions of fragment carrying b located between e and the 3′-end of y2. Part (2) indicates deletions, referred to as deletion I, including fragments carrying b and e, and y1. (C) Deletion II derived from a SLCT is shown in two steps. Transposases cut the 5′-end of y1 and the 3′-end of y2, as indicated by black vertical arrows in the top diagram. The 5′ and 3′ termini of y1 and y2, respectively, are re-inserted into the distal region with respect to the original Ds sites, as shown by the dotted arrows and red vertical arrowhead in the second diagram. Consequently, the 5′-end of y1 reinserted next to d causes inversion of fragments containing e and y1 and deletion of fragment containing c and y2, which is called deletion II.

