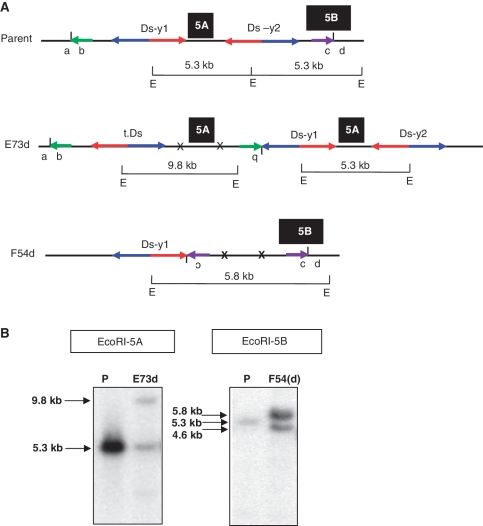
Figure 5.
Genomic structure and Southern blot hybridization of SCT-induced duplications. (A) Genomic structures of parent and SCT-induced duplications (E73d and F54d) are shown. Short vertical lines between a and b and between c and d indicate new junctions of E73d and F54d, respectively. X indicates Ds excision footprints and t.Ds means translocated Ds element. Green and purple short horizontal arrows indicate the orientations of the duplicated regions. Inversion of duplicated regions (b of E73d and c of F54d) is depicted as upside-down characters. Black boxes 5A and 5B indicate probe locations as described in Figure 3. The sizes of EcoRI fragments that span the probes are shown above horizontal bars marked with E, which stands for the EcoRI recognition site. The 5′ and 3′-ends of both Ds elements are indicated by blue and red arrows, respectively. (B) Duplication line E73d contains two bands: one band of 5.3 kb (same as parental, P), and a second band measuring 9.8 kb. These bands correspond to the fragments shown in (A). Line F54d contains a 5.8-kb band produced from the duplication chromosome whose structure is shown in Figure 5A, and a 4.6-kb band derived from a chromosome deletion. The parental (P) line produces a band of 5.3 kb. Breakpoints of the deletion (F54) and duplication F54d are shown in Table 2.

