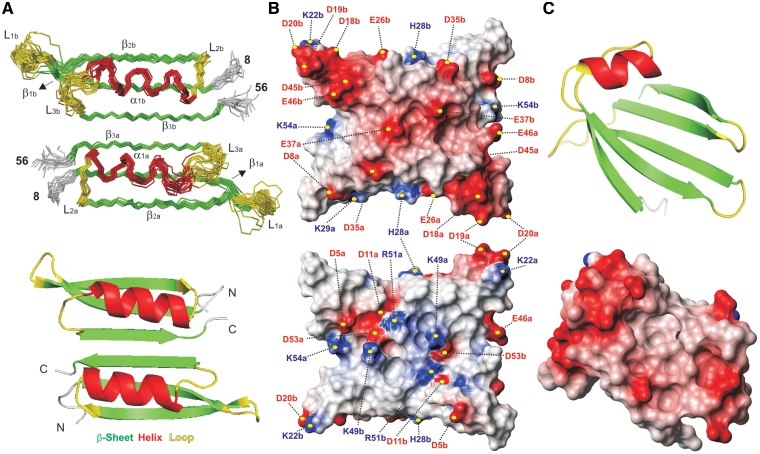
Figure 2.
(A) Backbone trace for the 20 lowest energy structures in the final NMR ensemble of the p56 dimer (Top) together with a ribbon representation of a single conformer (Bottom). Different monomeric units are labelled with subscripts a and b. Secondary structure elements are indicated by colour coding: α-helices (α1, red), β-strands (β1–β3, green), and loops (L1–L3, yellow). The disordered N-terminal tails (residues 1–7) are omitted for clarity. (B) Molecular surface representations of p56 showing the electrostatic potential (blue is positive and red is negative). The orientation of the p56 dimer in the top view is identical to that of the NMR ensemble shown in (A). Bottom view is related with the former by a 180° rotation around the x-axis. The position of the charged residues contributing to the inhibitor electrostatic potential is indicated. (C) Top: ribbon representation of the UDG-bound form of the inhibitor Ugi from phage PBS-1/PBS-2 (16) (pdb code 1EUI). Bottom: molecular surface representation showing the electrostatic potential at the UDG-binding surface of Ugi inhibitor.

