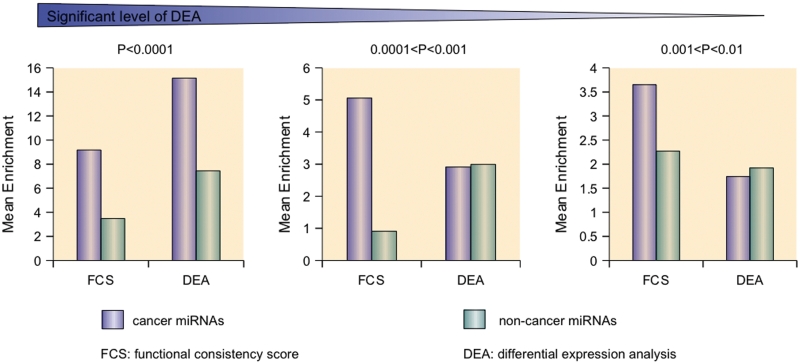
Figure 3.
Different distributions of expression significance and FCS values between cancer miRNAs and non-cancer miRNAs. The formula is enrichment = 108/(rank) for an interval of 216 miRNAs. The mean enrichment reflects the position of the cancer miRNAs in the prioritized list. FCS can distinguish cancer miRNAs and non-cancer miRNAs where cancer miRNAs are always enriched at the top positions at different expression significant levels. By contrast, expression analysis confused these two types of miRNAs.

