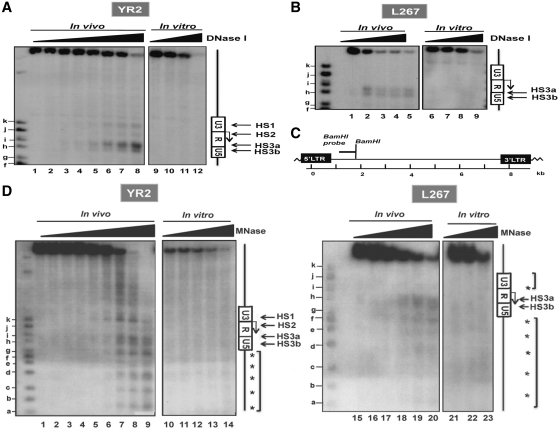
Figure 1.
Mapping of DNase I- and MNase-hypersensitive sites (HS) in the BLV 5′-LTR in two latently infected cell lines YR2 and L267. (A and B) Nuclei from YR2 (A) and L267 (B) cells were digested with increasing concentrations of DNase I (0, 10, 20, 30, 40, 45, 50, 55 U/ml and 0, 80, 90, 100, 120 U/ml, respectively; the high doses of DNase I used in L267 cells compared to those used in YR2 cells account for the lowest increase in nuclease hypersensitivity observed upon increasing concentrations of DNase I) and examined by indirect end-labeling following BamH1 digestion in vitro (lanes 1–8 and 1–5, respectively). Naked DNA purified from each cell line was digested in vitro by DNase I as a control (lanes 9–12 and 6–9, respectively). HS are indicated by arrows. Size markers were described in the ‘Materials and Methods’ section. The Figure shows one representative experiment from three independent IEL assays. (C) Schematic representation of the BamH1 probe (nucleotides 1422–2038) used in our indirect end-labeling experiments. (D) Nuclei from YR2 and L267 cells were digested with increasing concentrations of micrococcal nuclease (MNase; 0, 15, 30, 40, 50, 60, 80, 90 and 100 × 10−2 U/ml and 0, 15, 30, 60, 100 and 120 × 10−2 U/ml, respectively) and examined by indirect end-labeling following BamH1 digestion in vitro (lanes 1–9 and 15–20, respectively). Naked DNA purified from each cell line was digested in vitro by MNase as a control (lanes 10–14 and 21–23, respectively). The molecular weight markers were described in the ‘Materials and Methods’ section. HS are indicated by arrows; arrowheads indicate a discrete banding pattern corresponding to ∼160-bp nucleosome ladder. The Figure shows one representative experiment from three independent IEL assays.

