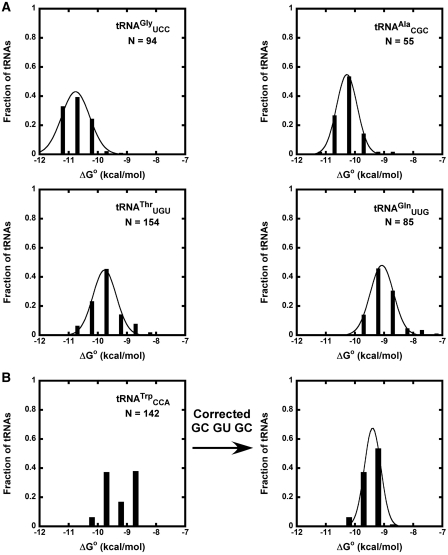
Figure 3.
Calculated ΔG° distributions for bacterial tRNAs. (A) Calculated ΔG° values for phenylalanylated  ,
,  ,
,  , and
, and  fit to Gaussian curves. Precisions of fit (R) and breadths (σ) of distributions are in Table 1. (B) Calculated ΔG° for
  before and after tRNAs containing the non-additive T-stem (G49C65 G50U64 G51C63) were substituted with the measured value.

