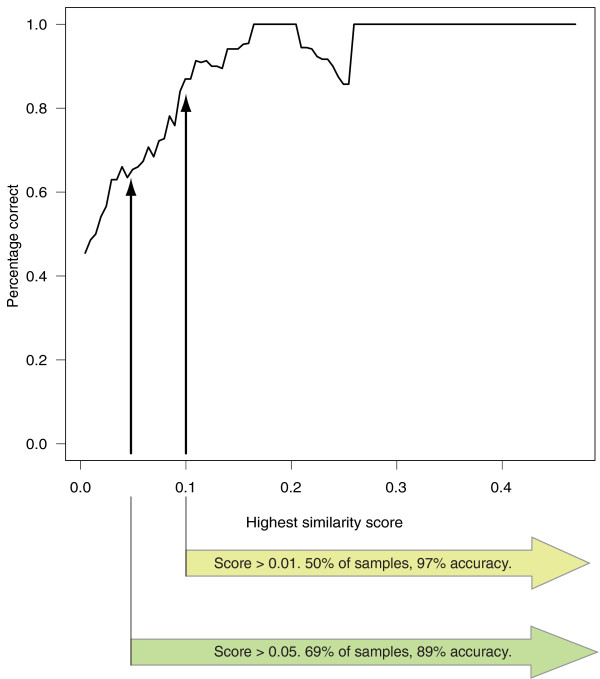
Figure 1.
A graph of the accuracy of the method as a function of the similarity score of the best hit. The graph was formed by moving a sliding window of width 0.1 along the score axis, which ranges from -0.021 to 0.495, and calculating the achieved accuracy within that window. As can clearly be seen, the better the similarity, the higher the probability that the classification is correct.

