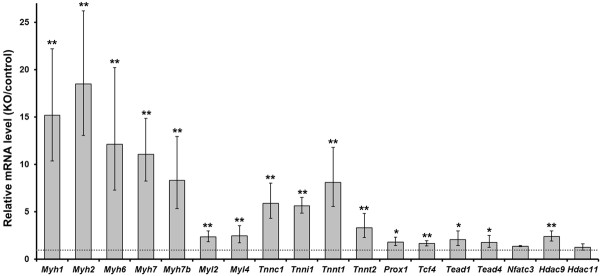
Figure 5.
Differences of expression levels of Sox6 target genes between control and Sox6 KO perinatal mice. RT-qPCR was performed using total RNA from skeletal muscle of control (Sox6f/f) and Sox6 KO (Sox6f/f; MCK-Cre) newborn (postnatal day 1) mice. Expression levels in Sox6 KO mice were divided by those in control mice, and represented as mean ± SD (n = 3). The broken line corresponds to the expression ratio of 1, indicating equal expression level between the KO and control mice. (*) P < 0.05; (**) P < 0.005. Fiber type specific genes: Myh1, Myh2, Myh7, My7b, Myl2 (also expressed in the heart), Tnnc1 (also expressed in the heart), Tnni1, Tnnt1; cardiac isoforms: Myh6, Tnnt2; developmental isoform: Myl4; transcription factors: Prox1, Tcf4, Tead1, Tead4, Nfatc3; histone modification enzymes: Hdac9, Hdac11.

