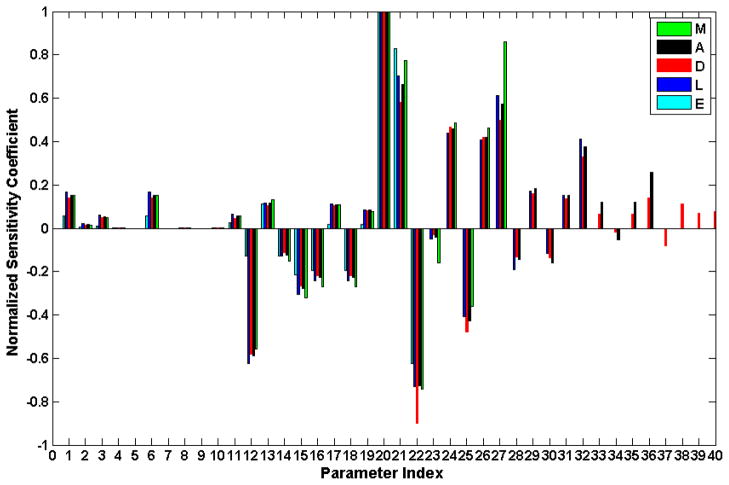
Figure 7.
Sensitivity analysis on the model parameters. Sensitivity coefficients are calculated by using Eq. (18) with δ p= 0.01. Normalization is obtained by dividing the raw sensitivity coefficient by the maximum one for each response. The numbered labels on the x-axis correspond to the parameter in Table 1.

