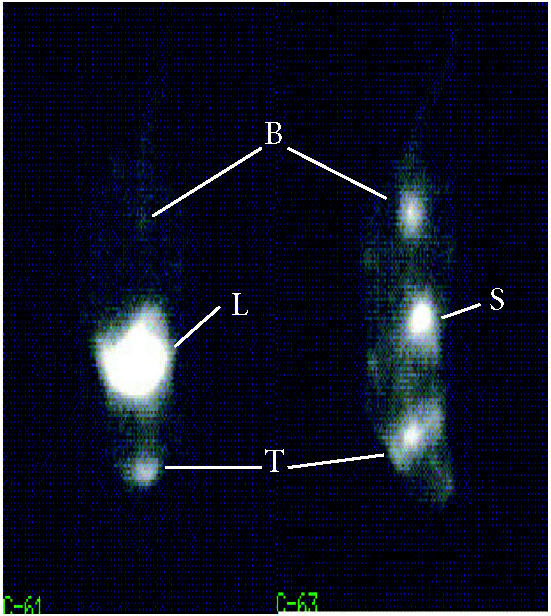
Figure 2.

Imaging of hNIS expression by PET. Individual coronal slices from PET images of two nude mice intravenously treated with 5 × 10⁷ GFU adenovirus in which a CMV promoter drives hNIS expression (left) and a PBS-treated control (right) followed, 72 hours later, by injection of [124I] iodide as a tracer. In both pictures, the chosen slice lies at the level of the thyroid region (T). Tracer is seen in the stomach (S) and in the bladder (B) of the control animal. Tracer uptake in the treated animal is in the upper abdomen consistent with adenoviral homing to the liver (for detailed experimental conditions, see [69]).
