
Figure 1.
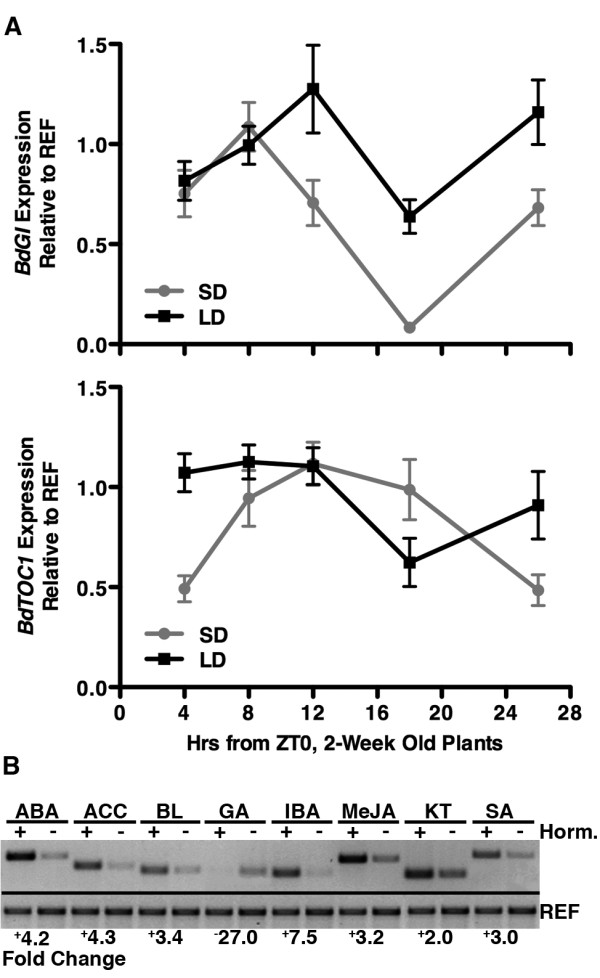
Library treatment confirmations. (A) Photoperiod library. SD and LD expression is shown for BdGI and BdTOC1 for the samples used to construct the photoperiod library (mean of four technical replicates/time point (±SEM)). Expression at each time point is relative to the REF gene (Bradi4g00660 [35], see Methods). Note that this should not be interpreted as a rigorous quantitative analysis of either gene, but is shown to demonstrate that samples used to construct the photoperiod library come from tissues experiencing varied light input with concomitant changes in gene expression. However, the SD and LD peaks of BdGI at ZT8 and 12, respectively, are similar to a previous report [32]. (B) Hormone library. Each treatment results in a clear change in the expression of the respective hormone marker gene. Quantitative values were generated by ImageJ (see Methods).