
Figure 7. Results of Computer Simulation II.

Probabilistic inference in the ASIA network with networks of spiking neurons that use different shapes of EPSPs. The simulated neural networks correspond to Implementation 2. The evidence is changed at  from
from  to
to  (by clamping the x-ray test RV to 1). The probabilistic inference query is to estimate marginal posterior probabilities
  ,
,  , and
, and  . A) The ASIA Bayesian network. B) The three different shapes of EPSPs, an alpha shape (green curve), a smooth plateau shape (blue curve) and the optimal rectangular shape (red curve). C) and D) Estimated marginal probabilities for each of the diseases, calculated from the samples generated during the first 800 ms of the simulation with alpha shaped (green bars), plateau shaped (blue bars) and rectangular (red bars) EPSPs, compared with the corresponding correct marginal posterior probabilities (black bars), for
 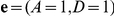 in C) and
  in D). The results are averaged over 20 simulations with different random initial conditions. The error bars show the unbiased estimate of the standard deviation. E) and F) The sum of the Kullback-Leibler divergences between the correct and the estimated marginal posterior probability for each of the diseases using alpha shaped (green curve), plateau shaped (blue curve) and rectangular (red curve) EPSPs, for
  in E) and
  in F). The results are averaged over 20 simulation trials, and the light green and light blue areas show the unbiased estimate of the standard deviation for the green and blue curves respectively (the standard deviation for the red curve is not shown). The estimated marginal posteriors are calculated at each time point from the gathered samples from the beginning of the simulation (or from
  for the second inference query with
 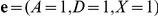 ).
).