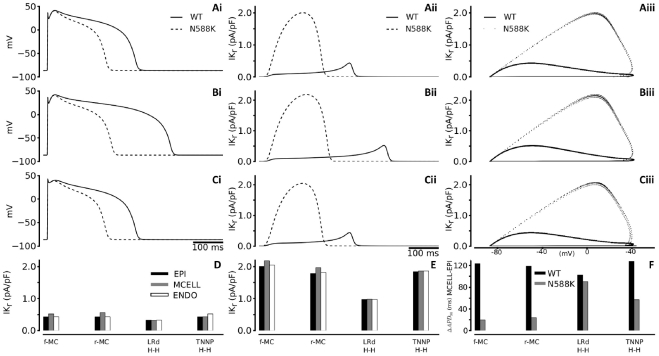
Figure 4. Simulation of action potential and IKr time courses.
(i) Steady state (1 Hz) action potentials for EPI (Ai), MIDDLE (Bi) and ENDO (Ci) cells using the full Markov chain IhERG/IKr model. Thick lines represent WT and dashed lines represent N588K condition. (ii) Corresponding IKr current profiles for EPI (Aii), MIDDLE (Bii) and ENDO (Cii) cells. Thick lines represent WT and dashed lines represent N588K condition. (iii) Corresponding I-V relationships for EPI (Aiii), MIDDLE (Biii) and ENDO (Ciii) cells. Thick lines represent WT and dotted lines represent N588K condition. (D,E) IKr current amplitude for EPI (black bars), MIDDLE (grey bars) and ENDO (white bars) cells for all four IhERG/IKr formulations for WT (D) and N588K (E) conditions (F) Computed APD difference between EPI and MIDDLE cells.

