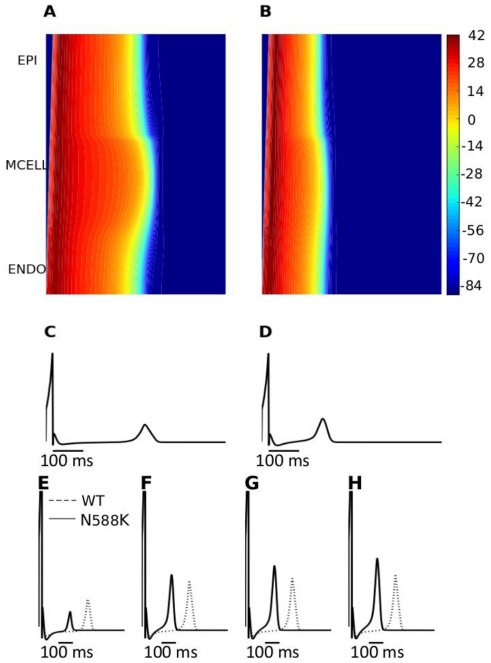
Figure 7. Space-time plot of AP propagation along a 1D transmural ventricular strand and computed pseudo-ECGs.
(A, B) Colour mapping of membrane potential of cells along the 1D strand from blue (−86 mV) to red (−42 mV) (see colour key). Space runs vertically from the ENDO end to the EPI end at the top. Time runs horizontally. (A) Control (WT) condition. (B) SQT1 (N588K) condition. (C, D) Pseudo-ECGs corresponding to the WT and SQT1 (N588K) conditions respectively. (E, F, G and H) WT and N588K pseudo-ECGs for the different EPI∶ MIDDLE∶ENDO IKr density ratios of 1.0∶1∶1, 1.5∶1∶1, 1.6∶1∶1 and 1.7∶1∶1 respectively.

