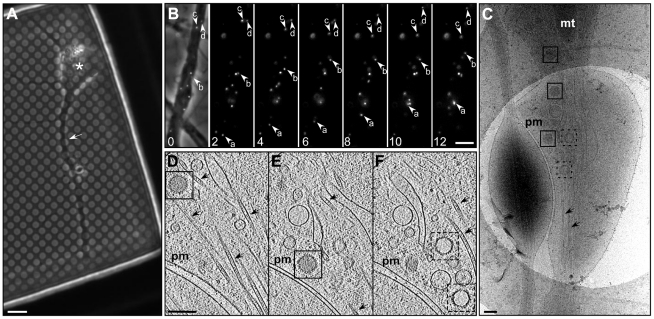
Figure 1. Transport of HSV1 capsids in neurons during egress.
(A) Bright field image of a hippocampal neuron grown on a holey carbon support film for 7 days. A neurite (white arrow) and cell body (asterisk) are indicated. Bar: 6 µm. (B) Series of time-lapse wide-field fluorescence images of a mid-axon region of a HSV1(KOS)-GFPVP26 infected neuron at 16 hours p.i.. Pictures were taken every 2 seconds, as indicated by the number in the lower left corner. The left image shows an overlay of the fluorescence channel with the bright field image. Arrows indicate the positions of individual viral particles. Bar: 5 µm. (C) Cryo electron microscopy (projection image) of an intact axon at 16 h p.i.. Cytosolic C-capsids are framed in black and cytosolic A-capsids in black dashed squares. (D–F) Slices through the reconstructed tomographic volume obtained from the area of interest in (C). pm: plasma membrane; mt: mitochondria; black arrows: microtubules. Bars in (C–F): 200 nm.

