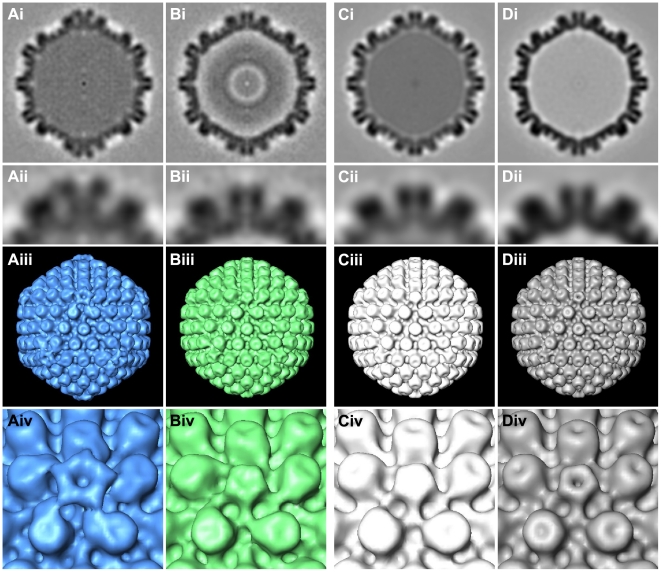
Figure 3. Subvolume averaging of cytosolic capsids.
Results from subtomogram averaging are presented for (Ai-iv) 41 cytosolic C-capsids, (Bi-iv) 26 cytosolic A-/B-capsids, (Ci-iv) 143 nuclear C-capsids and (Di-iv) 158 nuclear A-capsids. Row (i): central cross sections of the averages. Row (ii): close-up view of the top vertex in row (i). Row (iii): isosurface representation of the averages with a threshold of 1.5σ above the mean density. Row (iv): close-up view of a vertex from row (iii).

