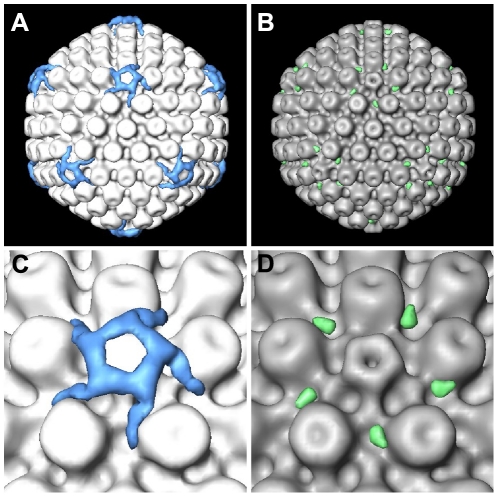
Figure 4. Difference maps between cytosolic capsids and nuclear capsids.
(A) Difference map between cytosolic C-capsids and nuclear C-capsids, superimposed onto the nuclear C-capsids average. (B) Difference map between cytosolic A-/B-capsids and nuclear A-capsids, superimposed onto the nuclear A-capsids average. (C, D) Close-up view of a vertex in (A) and (B), respectively. The isosurface thresholds for the difference maps are 1.5σ above the mean density in (A) and 0.5σ in (B).

