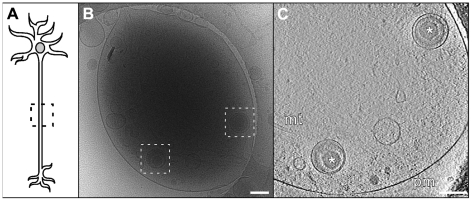
Figure 5. Enveloped virions in middle regions of axons.
(A) Schematic diagram of a neuron indicating the mid-axon region. (B) Cryo electron microscopy (projection image) of a pair of enveloped virions (boxed areas) in a mid-axon region vitrified at 16 h p.i.. Note the bundle of microtubules entering and leaving this area. Bar: 200 nm. (C) CryoET slice through the respective reconstructed tomographic volume for the field shown in (B). Asterisk: enveloped capsids; mt: microtubule; pm: plasma membrane. Bar: 200 nm.

