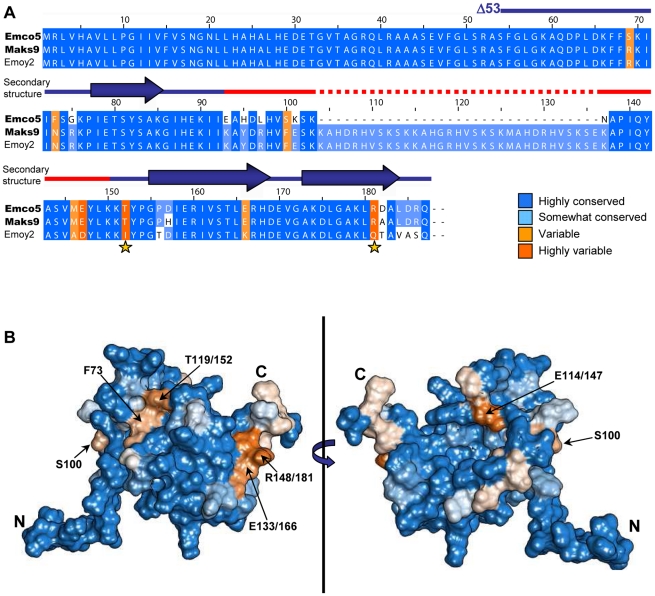
Figure 3. Naturally occurring polymorphisms of ATR13. A.
A clustalX alignment of ATR13 variants colored by percent conservation calculated from 15 isolates in Jalview; three are shown. ATR13 alleles recognized by RPP13Nd are shown to the left in bold. Residues previously implicated in recognition are marked by yellow stars. Secondary structure is represented above corresponding residues; lines denote coiled regions whereas arrows denote alpha helices. The red section marked on the secondary structure indicates disordered residues. B. Naturally occurring polymorphisms mapped onto a representative ATR13 structure rendered in Chimera. Polymorphic residues are shown in orange while conserved residues are shown in blue.

