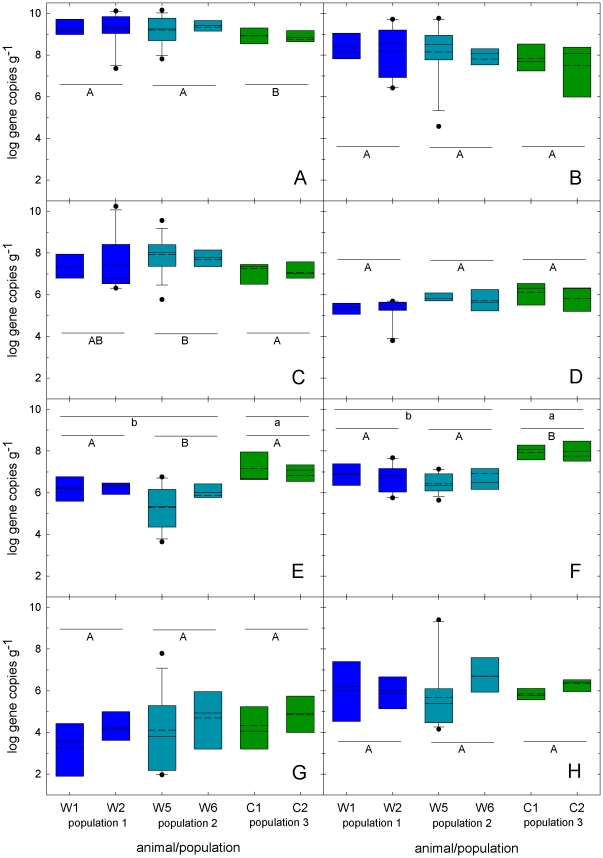
Figure 2. Bacterial groups present in the feces of wild and captive grizzly bears.
Bacterial groups (A, total Eubacteria; B, Enterobacteriaceae; C, Enterococcus; D, Lactobacillus, Pediococcus, Leuconostoc, Weissella; E, Clostridium cluster I; F, Clostridium cluster XI, G, Clostridium cluster XIV; H, Bacteroides-Prevotella-Porphyrmonas) detected in feces of a four wild (W1,W2, W5, and W6) and two captive (C1, C2) grizzly bears during sampling in 2009. Box plots show the 25 to 75% percentile range of the data in the box, the 5 to 95% range (whiskers), the median (middle line), and the mean (dashed line). Outliers are indicated by dots. Boxplots corresponding to the three populations are indicated by colour (population 1 blue, population two turquois, population 3 green). Differences between populations were analysed using one-way ANOVA. If data was not distributed normally, Kruskal-Wallis One Way Analysis of Variance on Ranks was applied (total Eubacteria, Enterobacteriaceae, Enterococcus, Clostridium cluster XI). Populations that do not share a common superscript (A,B) are significantly different (p<0.05). Abundance of Clostridium clusters I and XI was also compared in wild and captive animals (Kruskal-Wallis One Way Analysis of Variance on Ranks); their abundance was significantly different (p<0.05) if values for wild and captive animals do not share a common superscript (a,b).

