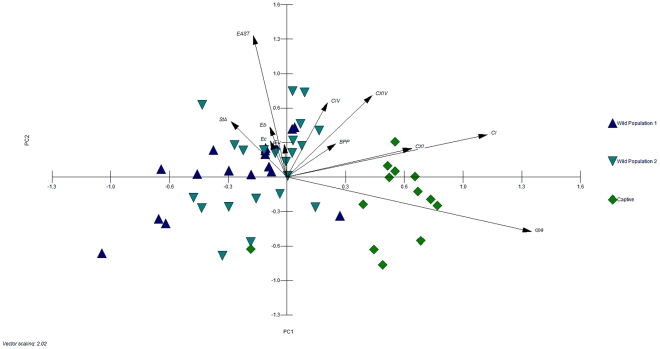
Figure 3. Correlation of housing conditions and stability of fecal bacterial communities in grizzly bears.
Score and loading biplot indicating the correlation between habitat, fecal microbiota, diet, and enteric pathogens of individual wild (W1, W2, W5, and W6) and captive grizzly bears (C1, C2). The first two principal components PC1 (x-axis) and PC2 (y-axis) account for 43% of the total variance. Variables with low weights are not displayed. The three populations are indicated by colours and symbols (population 1, blue triangle; population 2, turquoise inverse triangle; population, 3 green square). Eu, total Eubacteria; Eb, Enterobacteriaceae; Ec, Enterococci; BPP, Bacteroides-Prevotella-Porphyrmonas; CI, Clostridium cluster I; CIV, Clostridium cluster IV; CXI, Clostridium cluster XI; CXIV, Clostridium cluster XIV; EAST, heat-stable enterotoxin; STa, shiga-like toxin A gene; cpa, C. perfringens alpha toxin gene A.

