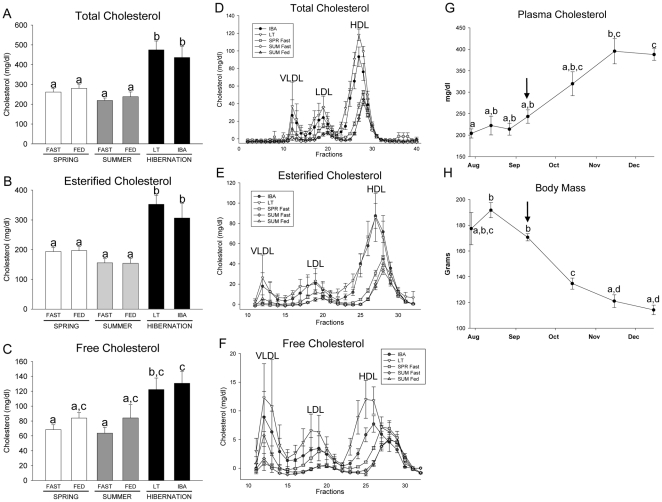
Figure 2. Plasma and lipoprotein cholesterol concentrations over the annual cycle.
Plasma total, esterified, and free cholesterol (A–C) in fasted and fed spring (SPR) (open bars) and summer (SUM) (grey bars) squirrels, and in hibernators (filled bars) during late torpor (LT), and interbout arousal (IBA) are shown. Total, esterified, and free cholesterol of fast protein liquid chromatography fractionated lipoproteins from a separate set of squirrels are shown (D–F). Plasma cholesterol (G) and body mass (H) of a third set of fed squirrels at 6, 4, and 2 wk prior to hibernation, on the day they entered the cold room (indicated with arrow), and at 4, 8 and 12 wk of hibernation are also shown. Groups with the same letter are not different. All values represent means ± s.e.m., n = 5 or 6.

