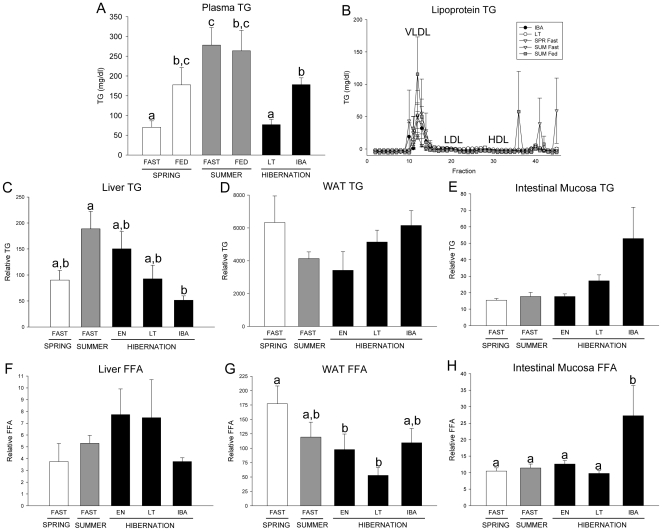
Figure 5. Plasma, lipoprotein, and tissue triglycerides (TG) and free fatty acids (FFA) over the annual hibernation cycle.
(A) Total plasma and (B) lipoprotein TGs following fractionation by FPLC in fasted and fed spring (SPR) (open bars) and summer (SUM) (grey bars) squirrels, and in hibernators (filled bars) during late torpor (LT), and interbout arousal (IBA) squirrels are shown. Tissue TG (C, D, E) and FFA levels (F, G, H) in liver, white adipose tissue (WAT) and intestinal mucosa in fasted SPR, SUM, entrance (EN), LT and IBA squirrels are shown. Groups with the same letter are not different. All values represent means ± s.e.m., n = 5–7.

