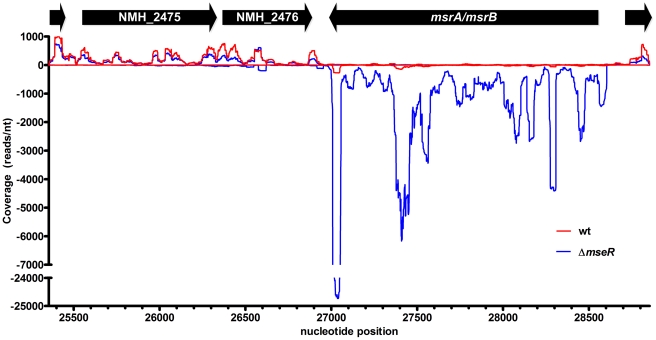
Figure 1. Read coverage visualization of the upregulation of msrA/msrB in H44/76ΔmseR (blue) versus H44/76 wt (red).
Transcription on the + strand is visualized on the positive x-axis, - strand transcription on the negative x-axis. Nucleotide position refers to contig9 of H44/76 WGS (AEQZ01000046.1). The relatively high peak of the last 50 nucleotides of msrA/msrB is present in both H44/76 wt and H44/76ΔmseR in both replicates. Expression of msrA/msrB through its ρ-independent terminator can be seen (see text for details), explaining the upregulation of anti-sense transcription of NMH_2475 and NMH_2476 shown in table 3.

