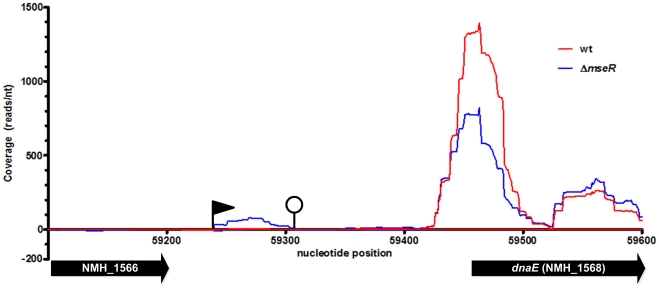
Figure 3. Read coverage visualization of the upregulation of the σEsRNA in H44/76ΔmseR (blue) versus H44/76 wt (red).
Transcription on the + strand is visualized on the positive x-axis, - strand transcription on the negative x-axis. Nucleotide position refers to contig4 of H44/76 WGS (AEQZ01000037.1). The black flag indicates a predicted TSS, the closed circle indicates a predicted ρ-independent terminator. The ORF of hypothetical protein NMH_1566 shows no expression. dnaE (NMH_1568), truncated in this picture with only 150 of 3435 nts shown, is not differentially expressed.

