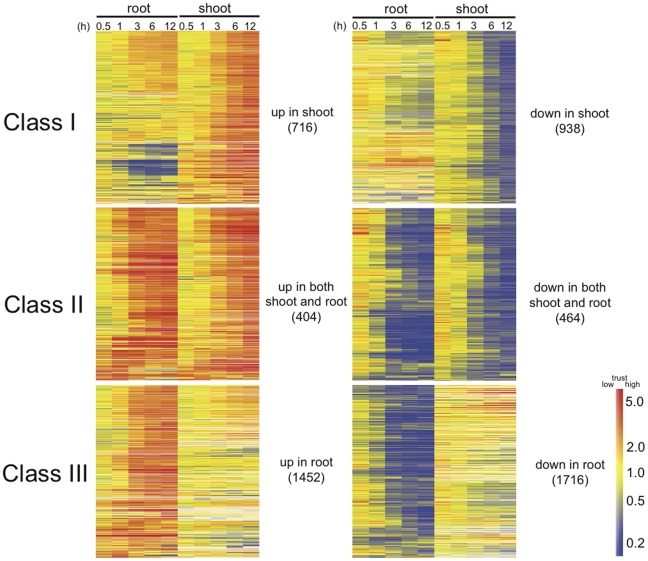
Figure 1. Shoot and root-specific genes responsive to root flooding.
Fourteen-day-old Columbia plants were root flooded for up to 12 hours. Shoots and roots were collected at specific time points (0, 0.5, 1, 3, 6, and 12 h). Total RNA was analyzed by microarray analysis with the 0 hour time point as the control channel. Three classes of genes were filtered by >2-fold change (upregulated) or <0.5-fold change (downregulated) expression with p values<0.05 at any one time point from 1 to 12 h in shoot and/or root. Class I, regulated in shoot only; Class II, regulated in both shoot and root; Class III, regulated in root only. Gene Tree Clustering was performed using the GeneSpring software package by Pearson Correlation similarity measure and Average Linkage clustering algorithm from each class of gene list. The numbers in parentheses indicate the number of genes in each class. Color scale indicates treatment-to-control ratios of expression. A lighter color in the scale indicates lower trust with a higher p value. Corresponding datasets can be found in Supporting Information File S1.

