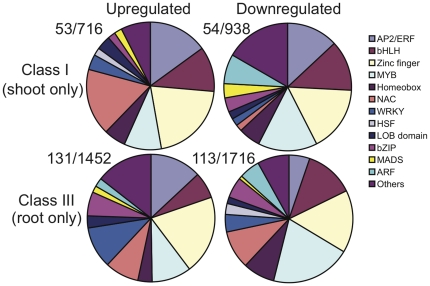
Figure 4. Subsets of transcription factors (TFs) were differentially expressed in shoots and roots under root flooding.
Pie chart depicting the proportion of regulated TF genes in protein families. Class I, genes regulated in shoots only; Class III, genes regulated in roots only. Upregulated and downregulated indicates up- or downregulated genes in either Class I or Class III. Ratio indicates TF number/total gene number in each class.

