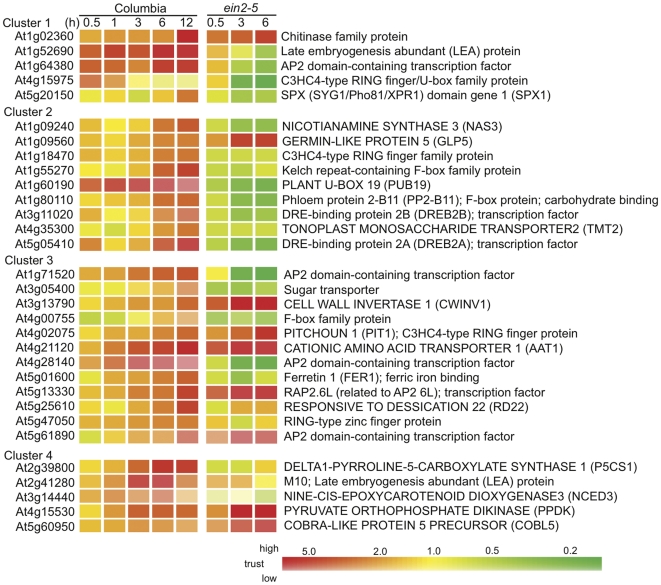
Figure 6. Heatmap of gene expression that are affected in shoot of ein2-5 during flooding of roots.
Genes were selected from the ANOVA filtered lists (Figure 5) in the systemic regulation of carbohydrate management and in functional categories of protein processing, hormone metabolism, RNA metabolism, amino acid metabolism, development, metal handling, and stress. K-means clustering were performed to classified these genes to four clusters based on their systemic expression profiles in the wild-type during flooding using the GeneSpring software package by Similarity Measure Pearson Correlation and one hundred iterations. Color scale indicates treatment-to-control ratios of expression. A lighter color in the scale indicates lower trust with a higher p value.

