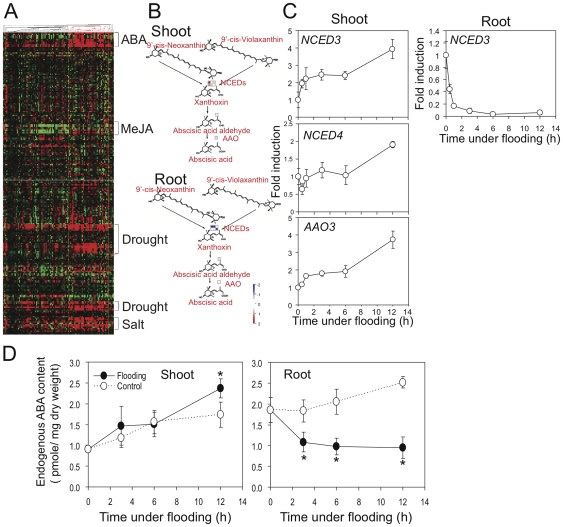
Figure 8. Gene associated with ABA biosynthesis are upregulated in shoots and downregulated in roots under flooding.
(A) Many hypoxic systemic responsive genes were ABA-, drought-, and salt-responsive genes. The list of highly induced genes filtered from Class I list (shoot induction only) by showing a >4-fold change in expression with spot intensity >200 at 12 hour flooding time point. A hierarchical clustering was performed via Pearson Correlation distance measurement in Genevestigator. Expression of these hypoxic long-distance induced genes in response to hormones and environmental stimuli were retrieved from Genevestigator database. (B) Genes associated with ABA metabolism were differentially regulated between shoots and roots under flooding of roots, as determined by Mapman software analysis. The Mapman overview of ABA metabolism showed that corresponding genes acted in an opposite manner in shoots and roots. Log2 expression values at the 6 h time point for individual genes are plotted as boxes as indicated color in the scale bar. (C) Expression of ABA biosynthesis genes was upregulated in shoot but downregulated in root under root flooding, as determined by Q-RT-PCR. Fourteen-day-old Columbia plants were root flooded for up to 12 hours. Shoot and root tissues were collected at specific time points (0, 0.5, 1, 3, 6, and 12 h). Total RNA was analyzed by microarray (B) and quantitative RT-PCR (C) using gene-specific primers. In Q-RT-PCR, the level of Tubulin mRNA was used as an internal control. The data represent means ± S.D. from six independent biological replicates. Gene abbreviations are as follows: NCED, NINE-CIS-EPOXYCAROTENOID DIOXYGENASE; AAO3, ABSCISIC ALDEHYDE OXIDASE 3. Gene details are shown in the Supporting Information Table S10. (D) Endogenous ABA contents were slightly increase in shoots but rapidly reduced in roots under roots flooding. Fourteen-day-old Columbia plants were root flooded for up to 12 hours. Seedlings on wet filter paper without flooding were collected at corresponding time points as controls. The data represent means ± S.D. from four independent biological replicates, and an asterisk indicates a significant difference between root flooded and control samples (P<0.05).

